

Log Pipeline
What is the Log Pipeline?
Kolide’s Device Properties and Checks features regularly poll the current state of your devices to provide up-to-date information. For users who wish to forward and store their device data outside of Kolide, we offer our Log Pipeline.
The Log Pipeline allows you to log all changes that are happening on a device, and track these changes happening across your fleet. Beyond the data Kolide already collects and stores in Inventory, you can also track things like:
- Process Events
- File Changes via File Integrity Monitoring
- Hardware Events
- System Logs
- …and any other data Osquery is capable of collecting (see schema)
You can then easily configure where you want the logs to be sent. Currently we support three types of log destinations:
These logs can be populated from one of several sources:
- Device Properties
- Query Packs
- File Integrity Monitoring (FIM)
- Custom Osquery SQL Queries
Getting Started
To get started, log into Kolide and click on Tools from top navigation and select Log Pipeline.
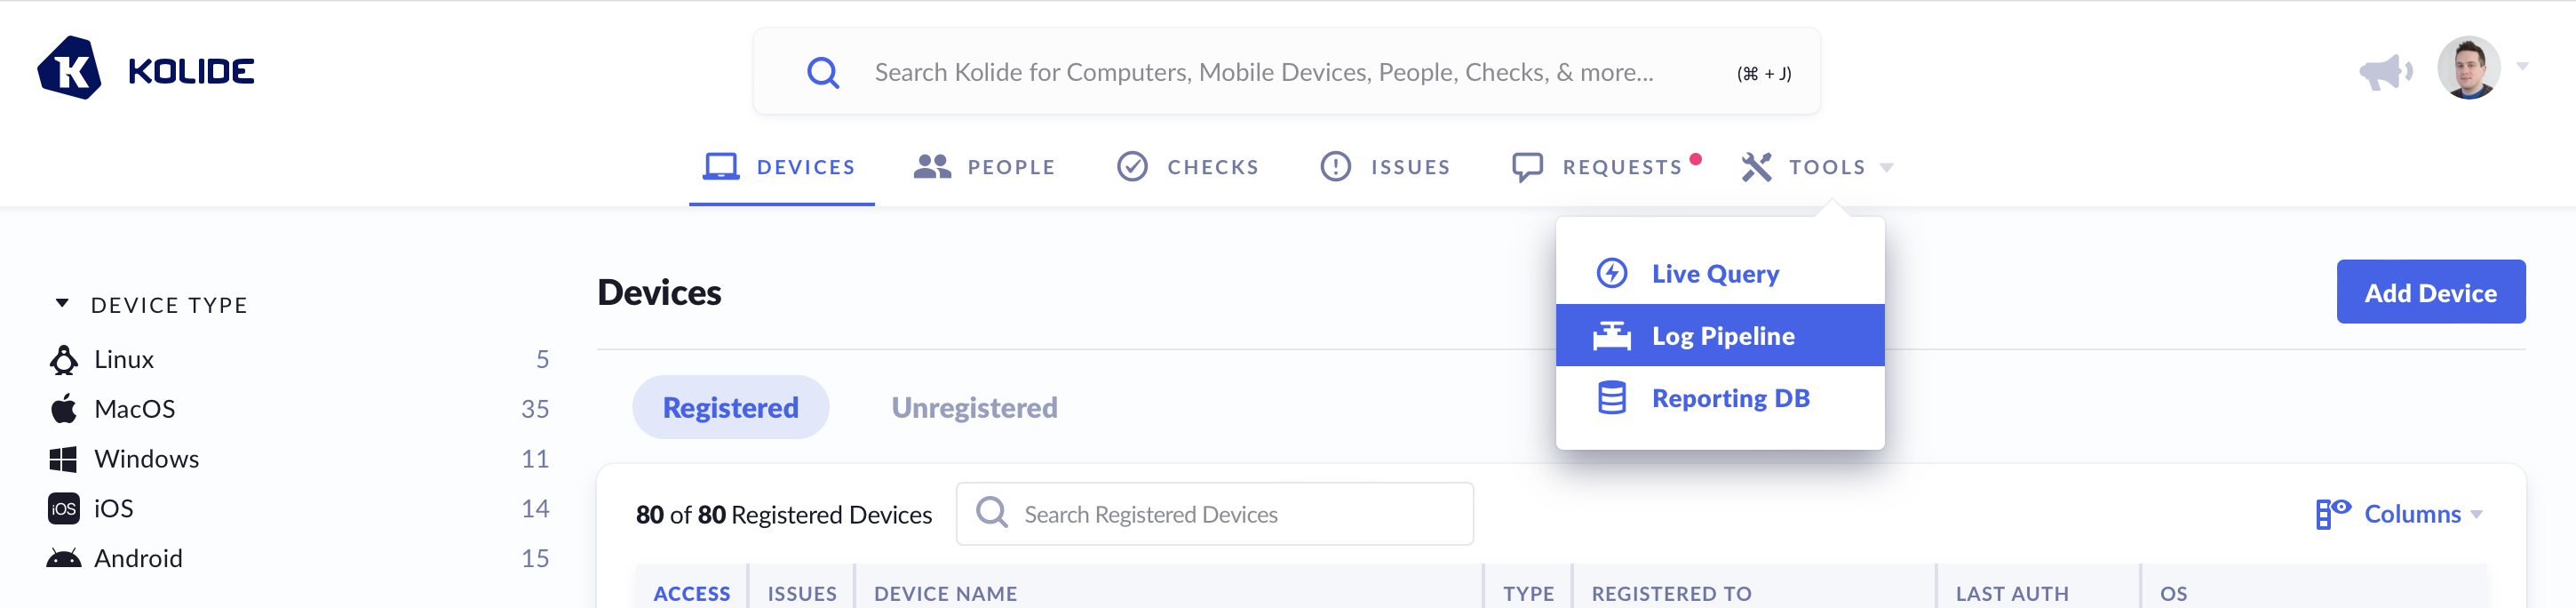
Underneath Log Pipeline are several pages:
- Device Property Loggers - Allows you to enable logging for Device property data
- Osquery Packs - Configure custom osquery Packs to extend data collection
- Log Destinations - Specify the place where logs will be forwarded to.
- Live Log Viewer - Preview real time log pipeline data.
You can configure additional osquery specific settings by going to Options under osquery settings. Here you can adjust customizable options for the underlying osquery agent.
There are also two osquery-specific features which can be configured:
- Decorators - Decorators can append supplementary device information to logs.
- File Integrity Monitoring Categories - Specify file paths to monitor using the osquery FIM
Device Property Loggers
The easiest way to get started with the Log Pipeline is exporting Kolide’s device property data. Without writing any SQL, you can enable logging for any device property available across devices.
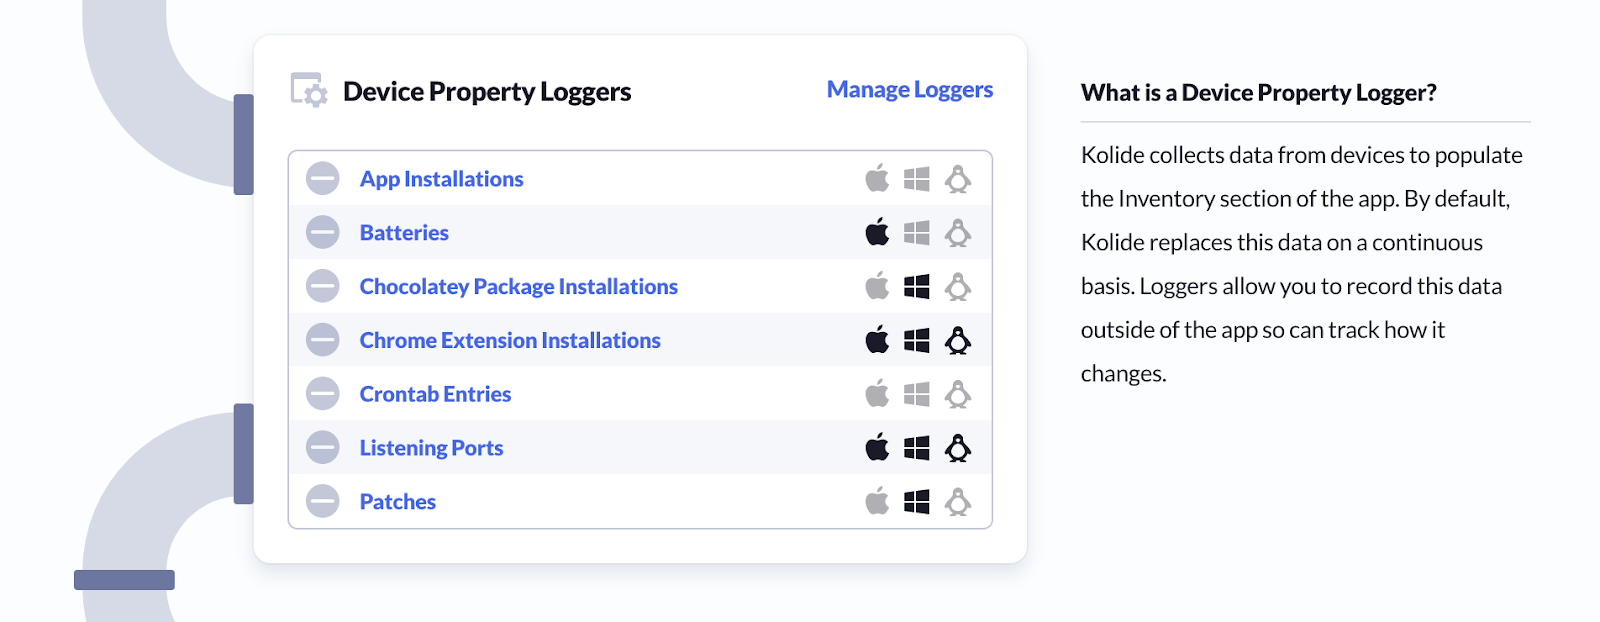
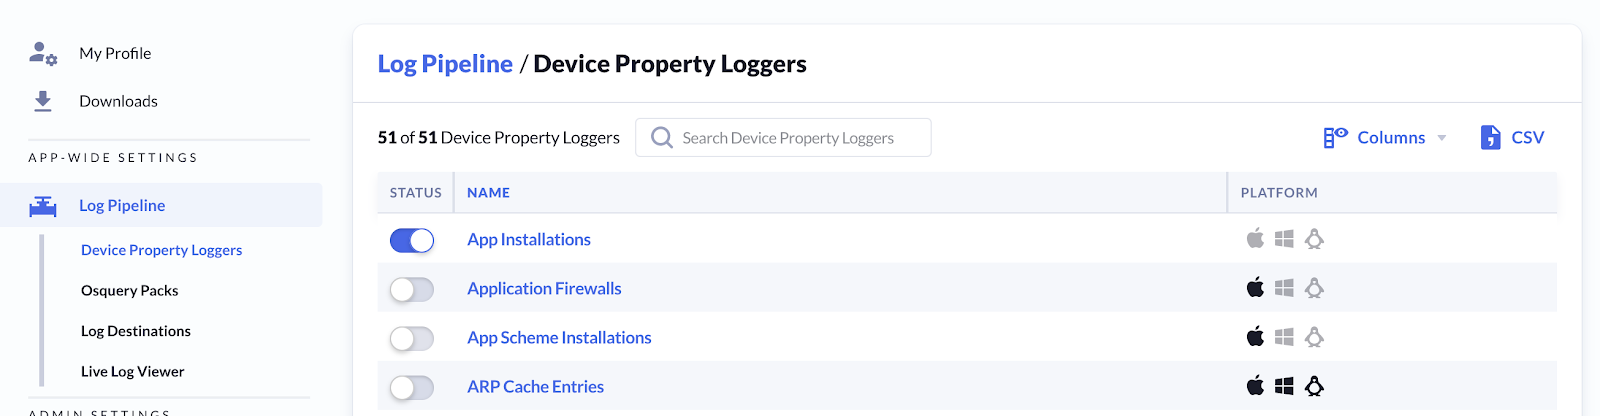
To enable logging for a Device Property:
- Go to the Log Pipeline
- Under Device Property Loggers, Click: Manage Loggers
- Enable the toggle switch next to the item of interest
Kolide will now begin forwarding results of these inventory items to your configured log destinations.
Osquery Packs
Osquery Packs are collections of one or more queries that run on a recurring interval (per-query).
For example you could create a Query Pack called Browser_Extensions which logged all known browser extensions. This pack would be populated by three separate queries, one each for:
SELECT * FROM chrome_extensionsSELECT * FROM firefox_addonsSELECT * FROM ie_extensions
For each of these queries you could specify:
- Interval - How often the query is run
- Shard - The percentage of my fleet I wish to run the query against
- Log Type - What type of result I want to receive (snapshot vs differential)
- Platform - Which device platforms I want to run the query against (macOS, Linux, Windows)
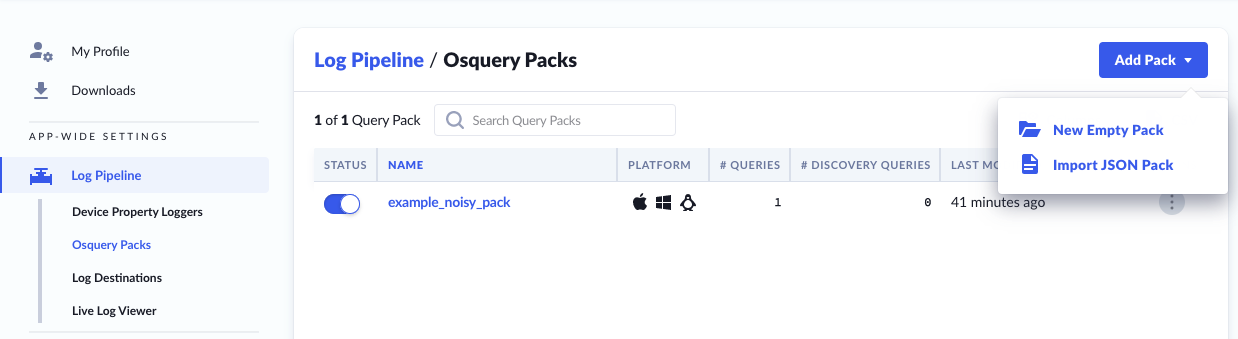
There are two methods which you can use to add Query Packs:
- New Empty Pack - You can write and save SQL queries in the UI
- Import JSON Pack - You can import using the standard osquery pack format
New Empty Pack
The first way we can create a new Query Pack is the manual method. Here we will write the SQL queries and specify their options within the Kolide UI.
- Navigate to Log Pipeline
- Click on Osquery Packs from the left-hand sidebar menu
- Click Add Pack button
- Select New Empty Pack from the dropdown
- Add a name and optional description
- Designate which platforms to run the queries on (which you can edit later)
- Set a minimum osquery version
- Set Shard Shard (In Percent) is a setting that restricts this query pack to a percentage (between 1-100) of target hosts..
You can read more about query packs in the osquery documentation.
Import JSON Pack
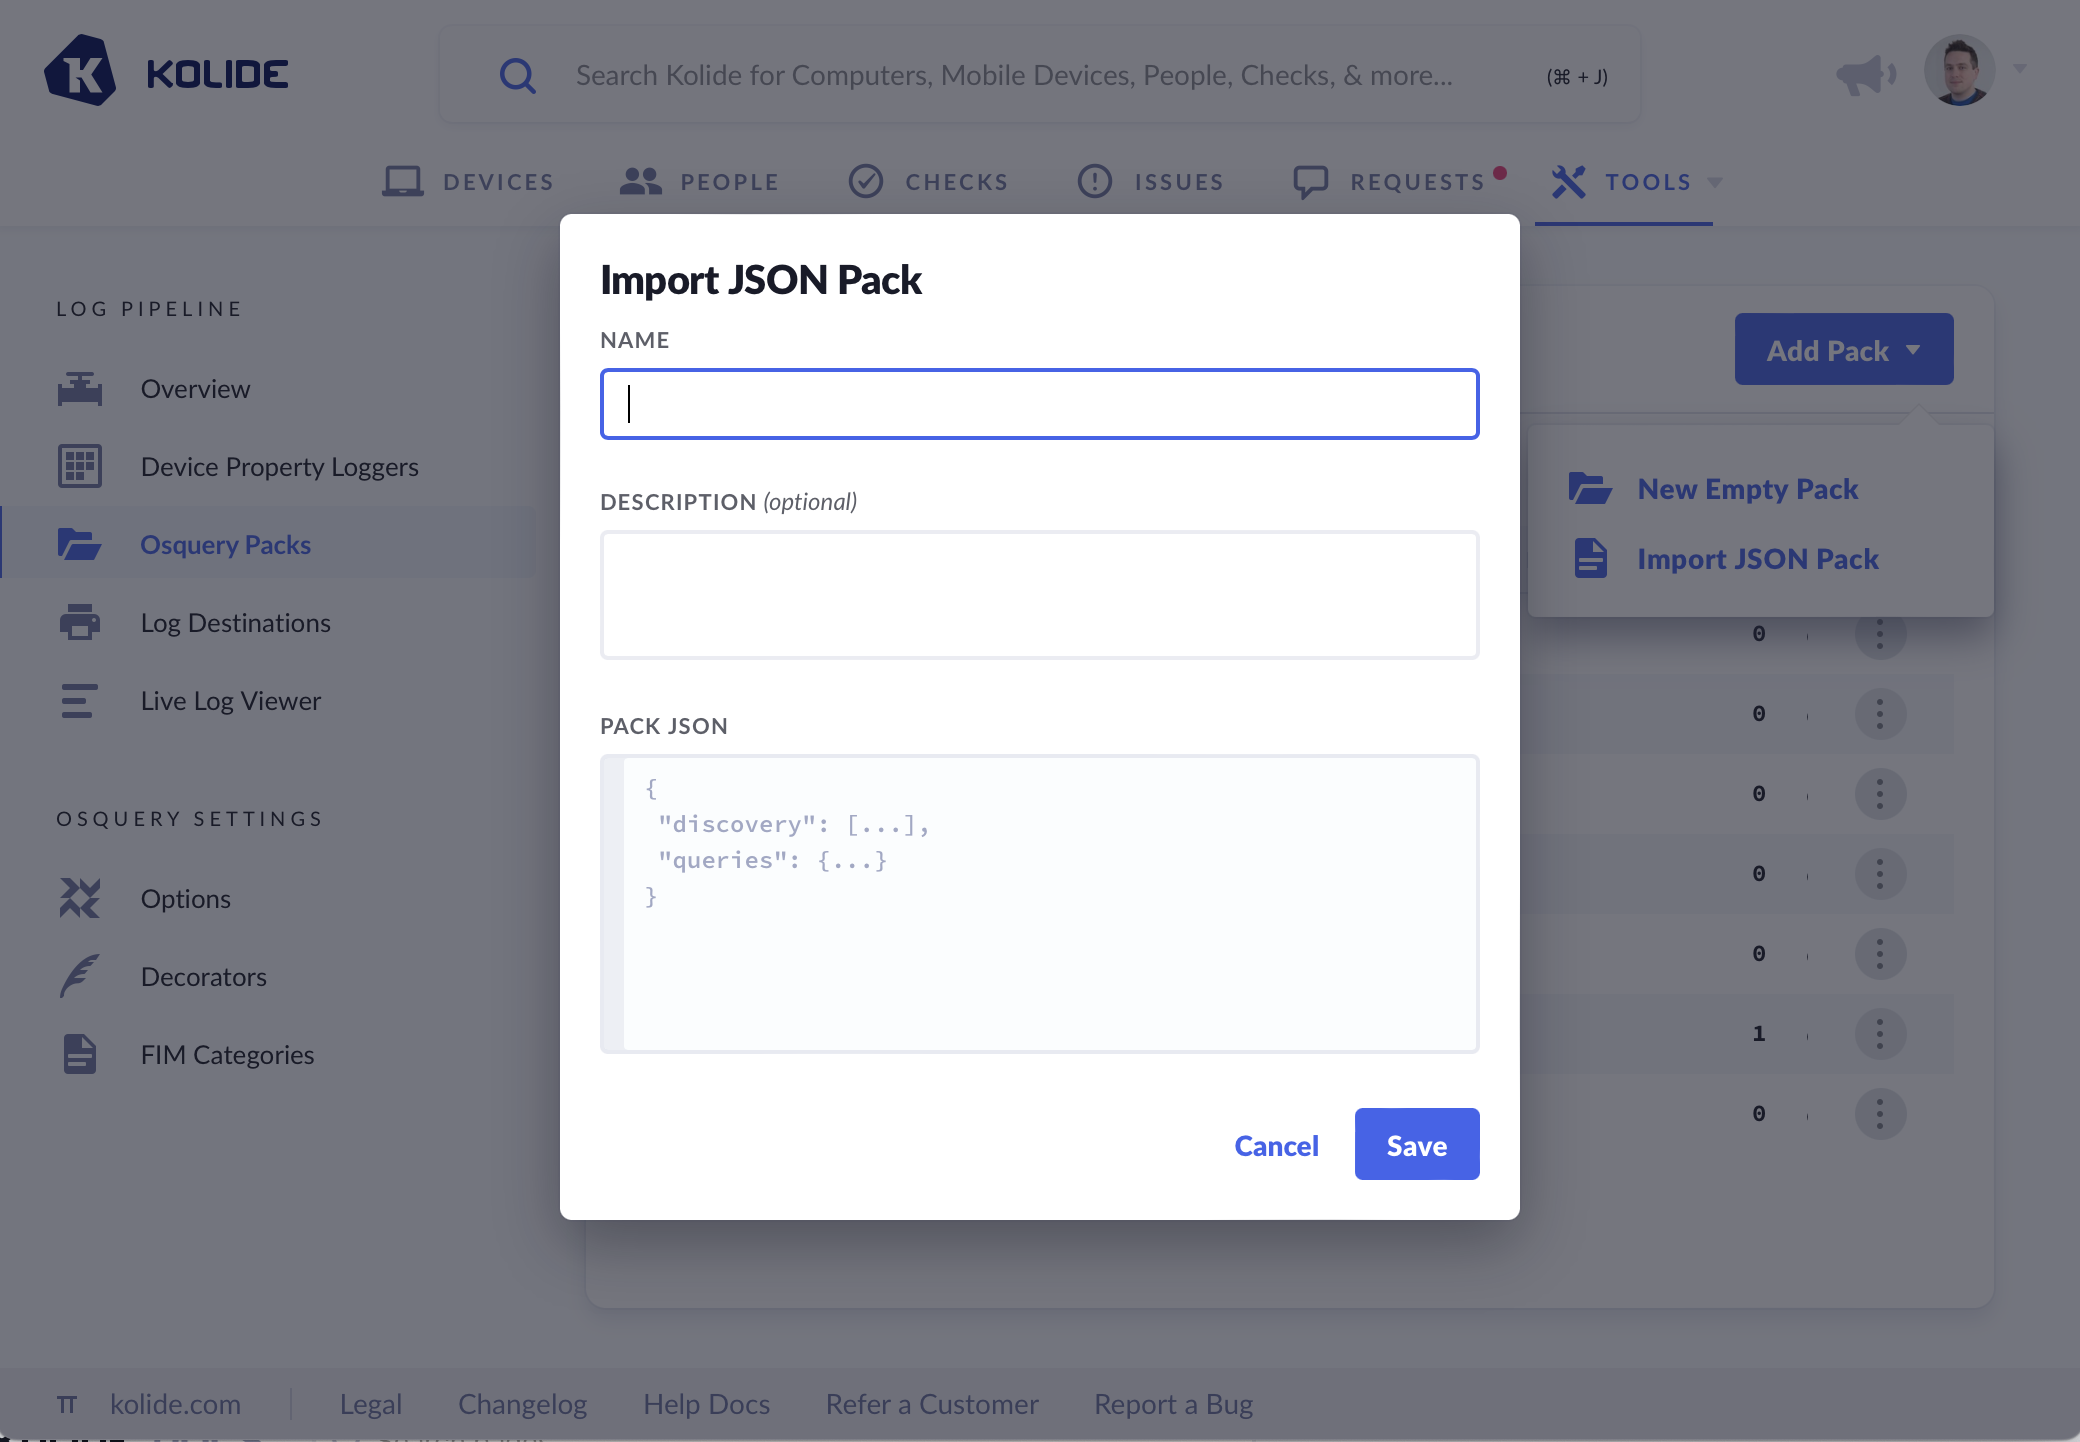
If we have existing Query Packs written we can add them by importing the Pack JSON. To Import a JSON Pack:
- Navigate to Log Pipeline
- Click Osquery Packs from the left-hand sidebar menu
- Click Add Pack button
- Select Import JSON Pack from the dropdown
- Add a name and optional description
- Paste valid Osquery Pack JSON into the text area.
You can read more about query packs in the osquery documentation.
Queries inside the packs
Once a pack is created, you will want to add queries you’d like to run within the pack. You can add new queries to the packs, and edit the queries once they are added.
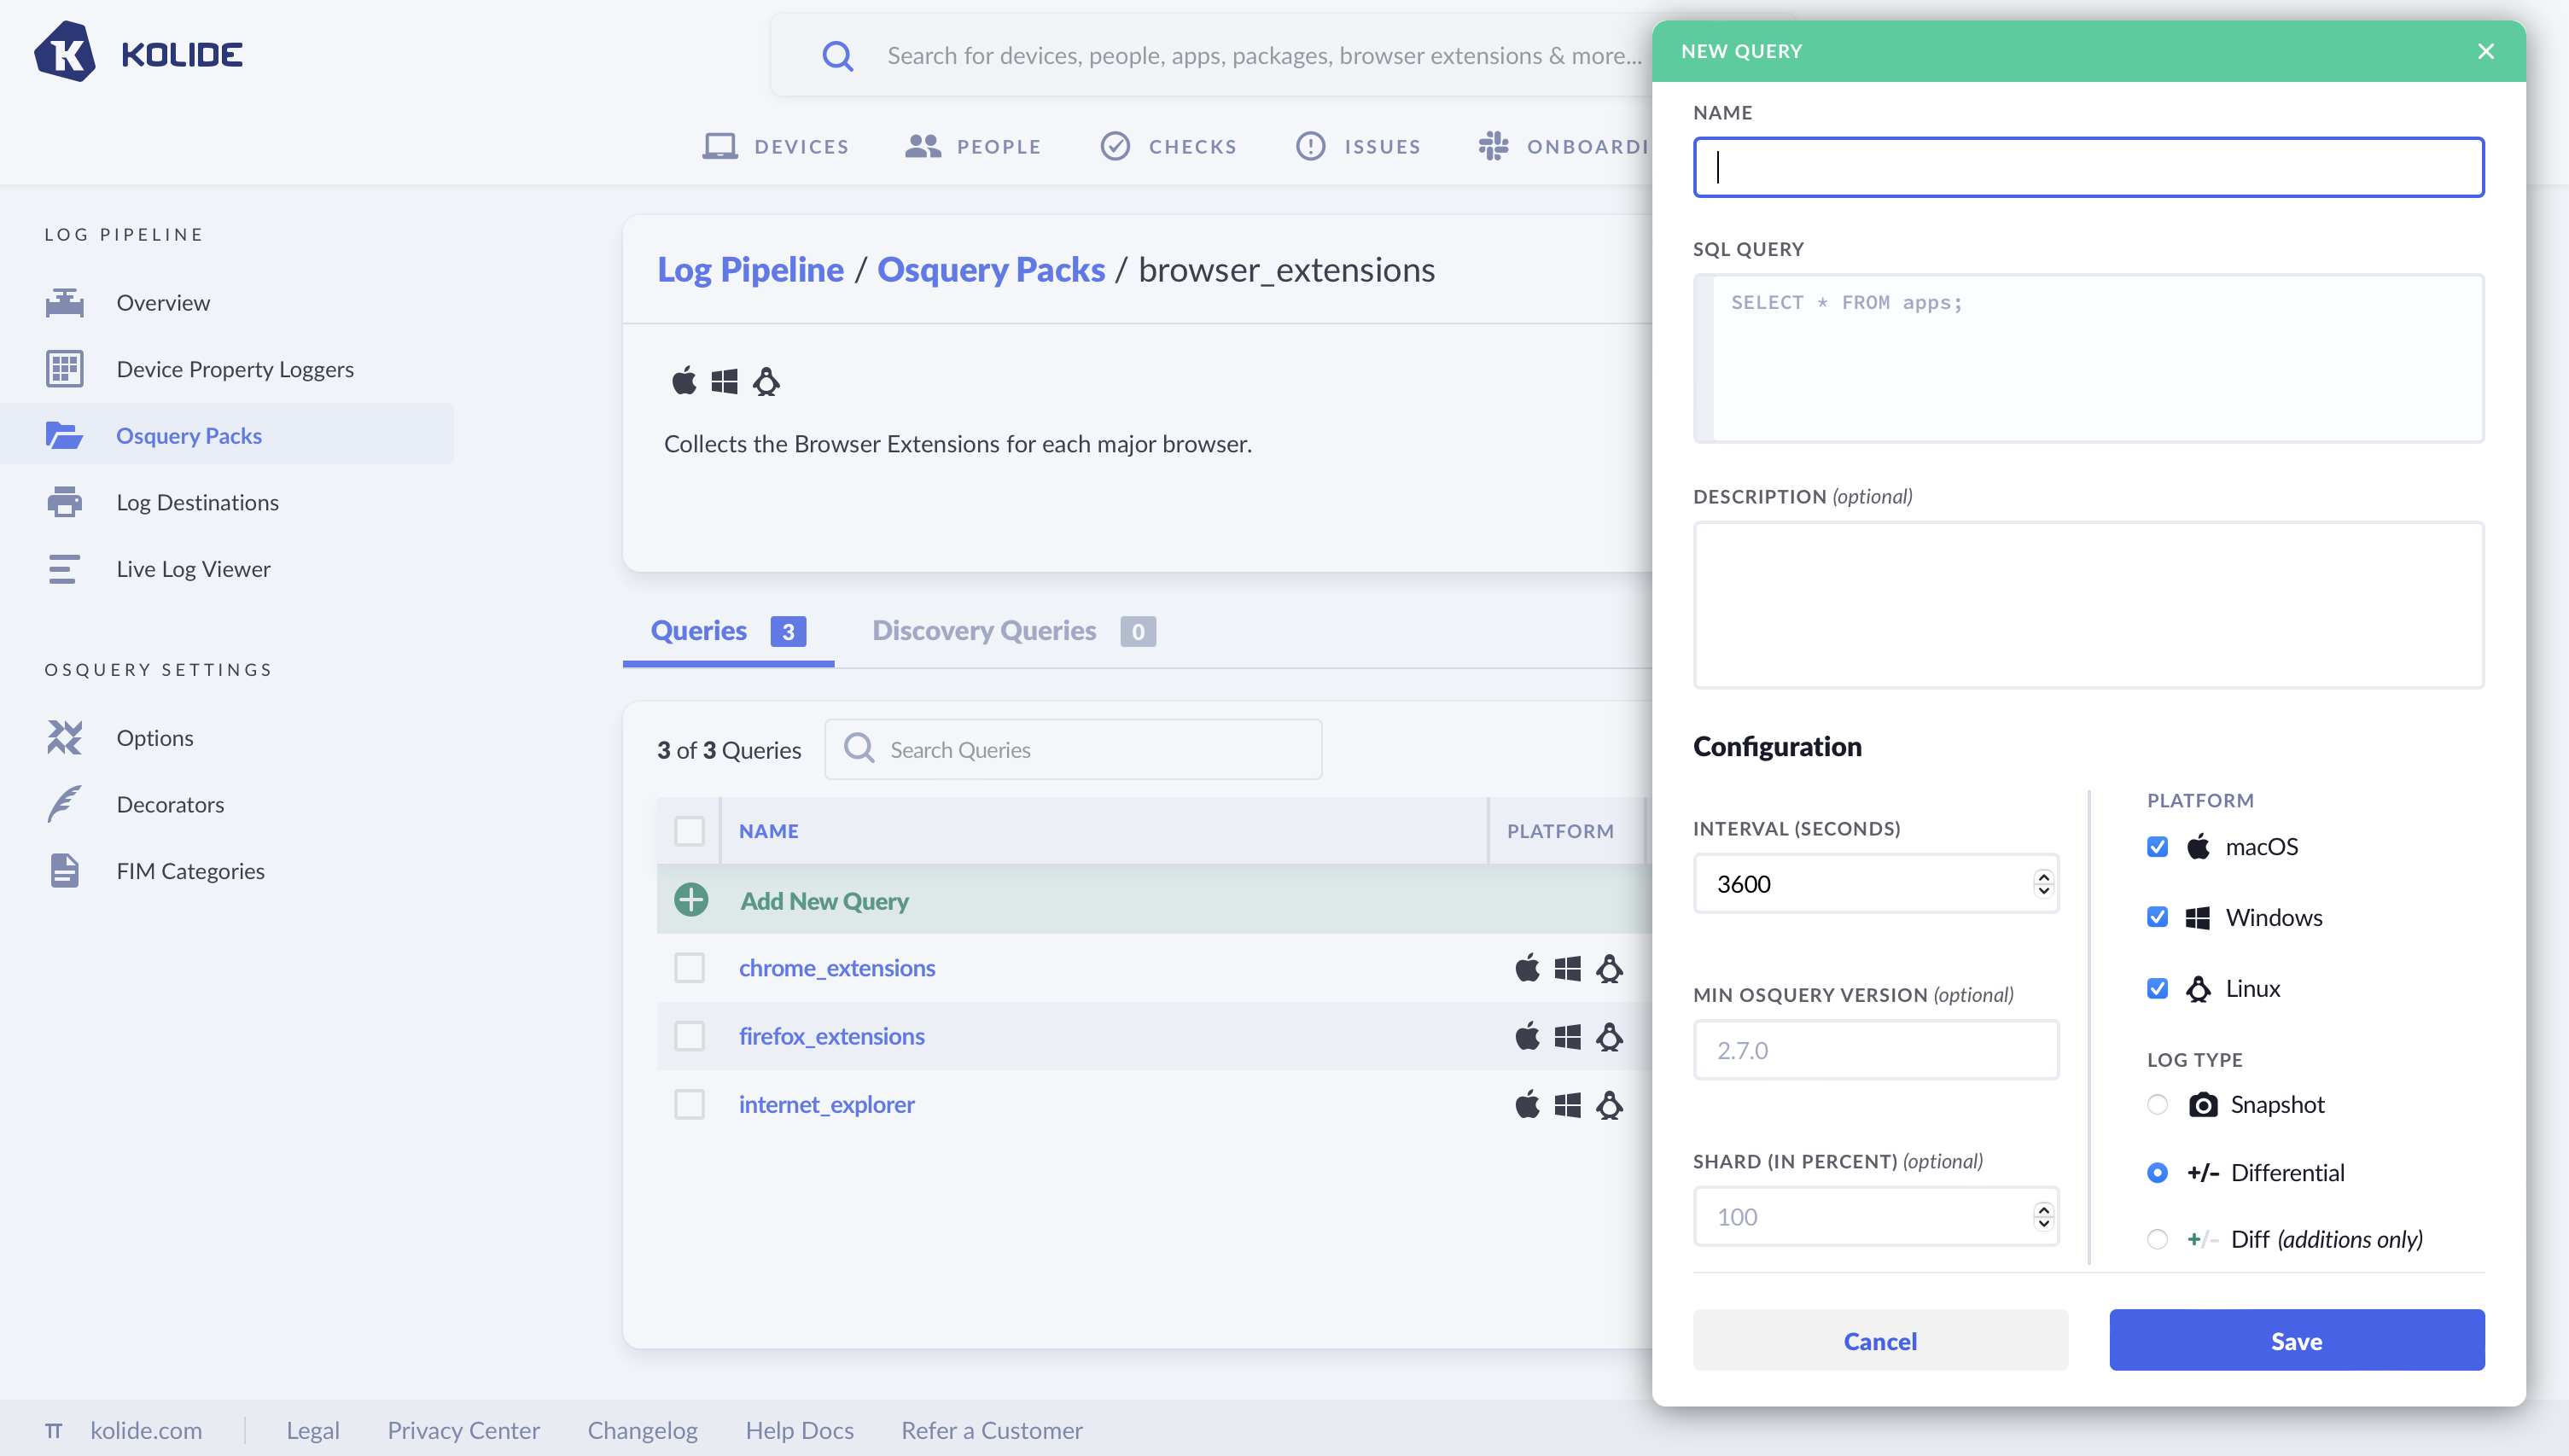
Log Type:
- Snapshot - Every time the query runs, you get a full set of results https://osquery.readthedocs.io/en/stable/deployment/logging/#snapshot-format
- Differential - Emits only the changes from the prior results (in batch format). https://osquery.readthedocs.io/en/stable/deployment/logging/#differential-logs
- Differential with additions only - Emits a batch format log when something changes, with only additions, not what used to be there.
Live Log Viewer
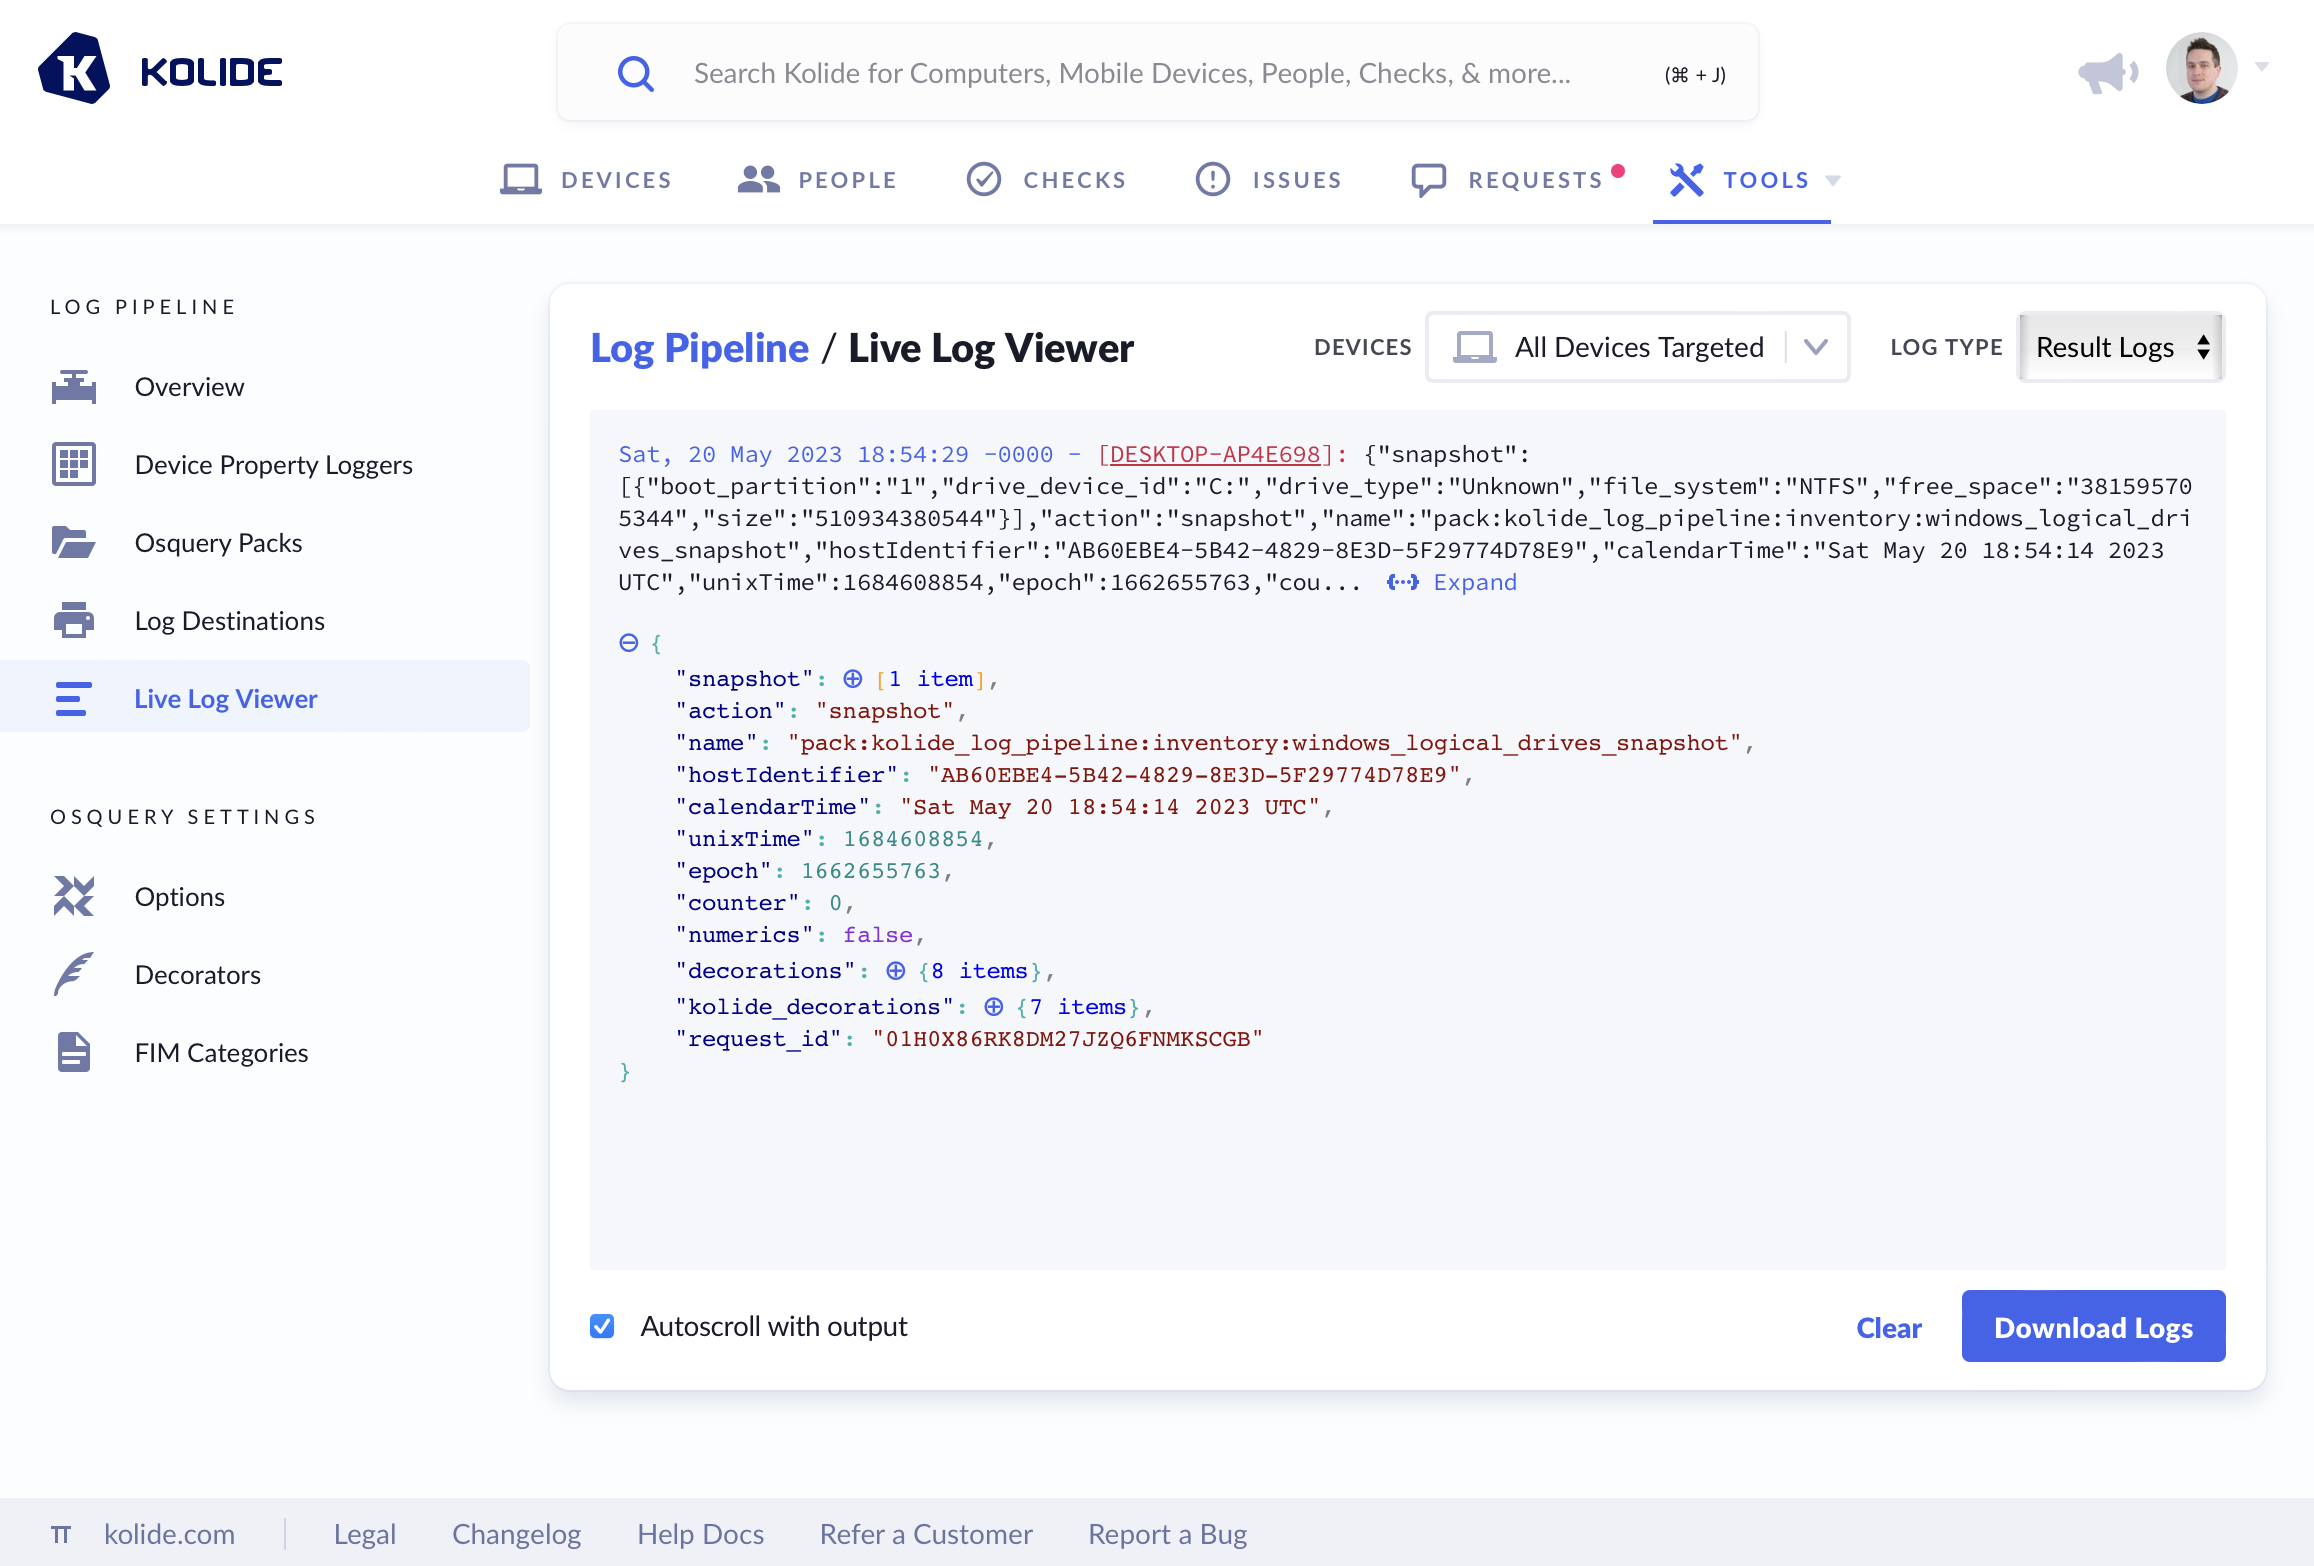
To aid in debugging, the Live Log Viewer allows you to see logs that are being received in real time. Simply choose the device (or devices) you’d like to stream logs from and the type of logs you’d like to stream. Once your selections are made, logs will start appearing as Kolide receives them.
Log Destinations
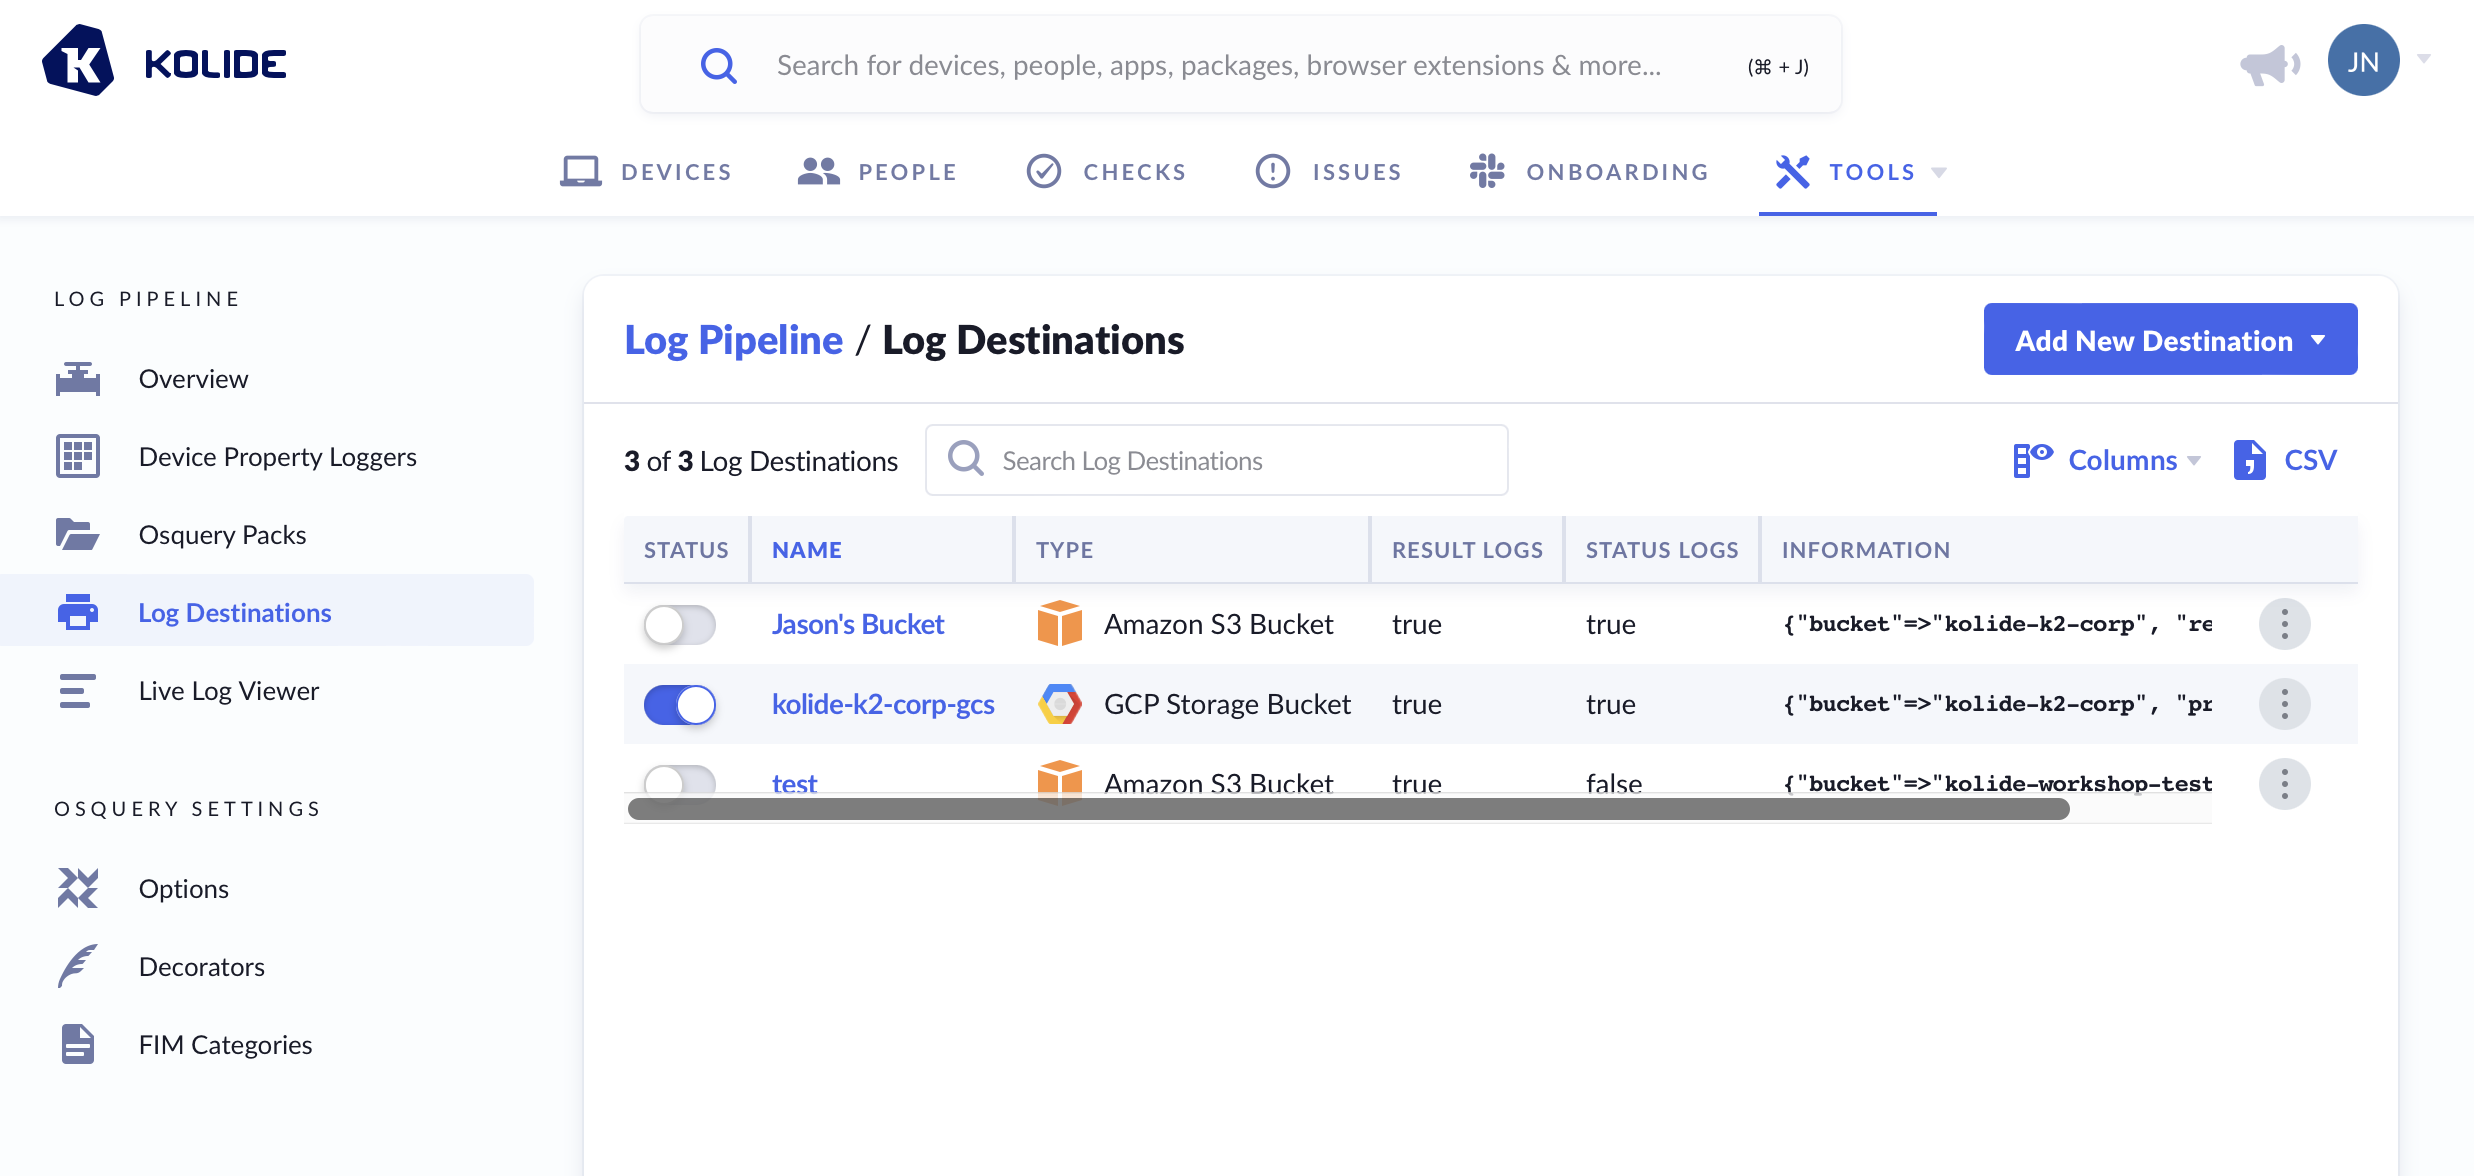
To utilize the Log Pipeline, you will need to configure at least one destination where Kolide can forward logs. There are three supported Log Destinations:
Log Formatting
Inside each log written to a bucket or posted to Splunk, you will find a single JSON object (or an array of JSON objects if viewing status logs). These logs will be in Osquery snapshot format (for queries explicitly marked as “snapshot” or it batched event mode format. Status logs utilize GLOG’s JSON formatting.
Beyond the default information sent by Osquery, Kolide further “decorates” this data with the following additions:
-
kolide_decorations- Contains information about the device useful for correlating it to the Device and its registered owner in our API. -
request_id- The ULID representing the HTTPS request made by the Osquery agent (matches the object name in the bucket)
Osquery Settings
The Osquery Options page allows you to adjust the configuration of the osquery agent. We strongly recommend using the default values, but provide access to these options, for advanced users, who need to fine-tune the behavior of the osquery agent on their devices.
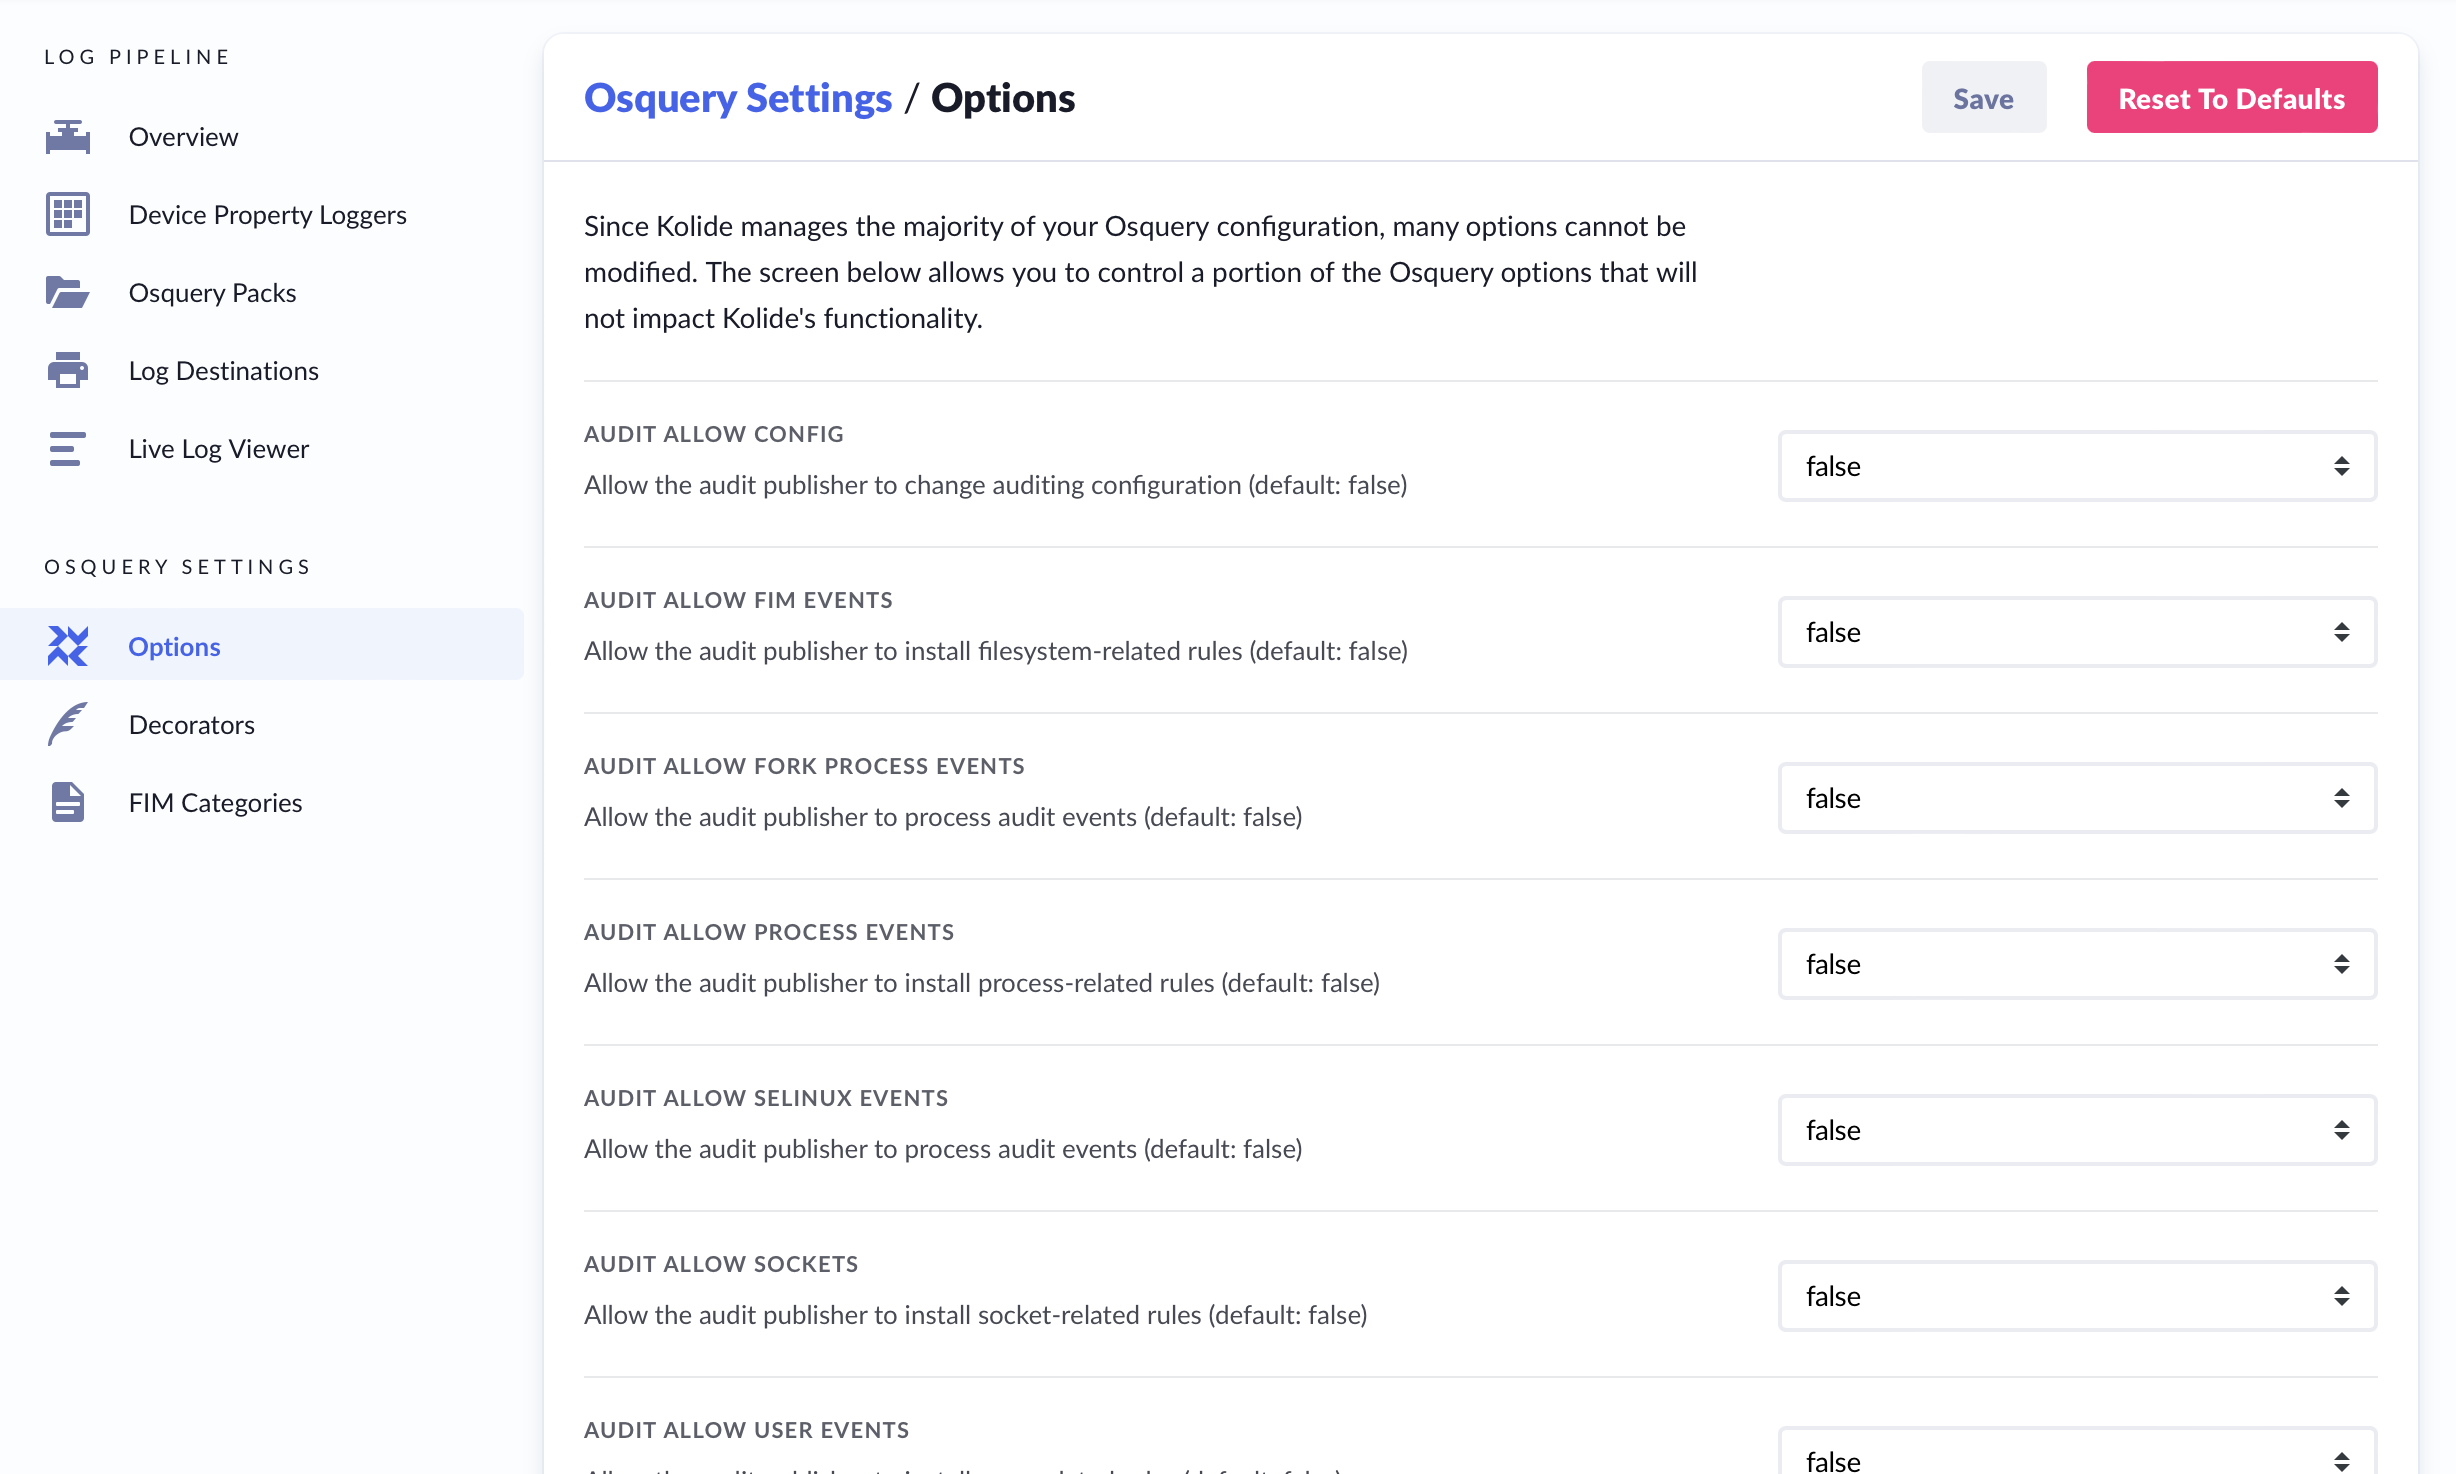
If you accidentally make changes that you wish to revert, you can navigate away from the page without saving. If you accidentally save changes and wish to revert to the original configuration, you may click the button marked: ‘Reset to Defaults’.
Decorators
Query pack results can be supplemented with additional data called decorators (eg. the device’s hostname). These decorators are added to each result in the log-file. Decorators can be used to more easily identify a host.
In this section, you can add your own decorators by creating a name, which will be added to results in the log-file, select which OS platform you want to run the decorators on, designate a Run Type, as well as a SQL Query.
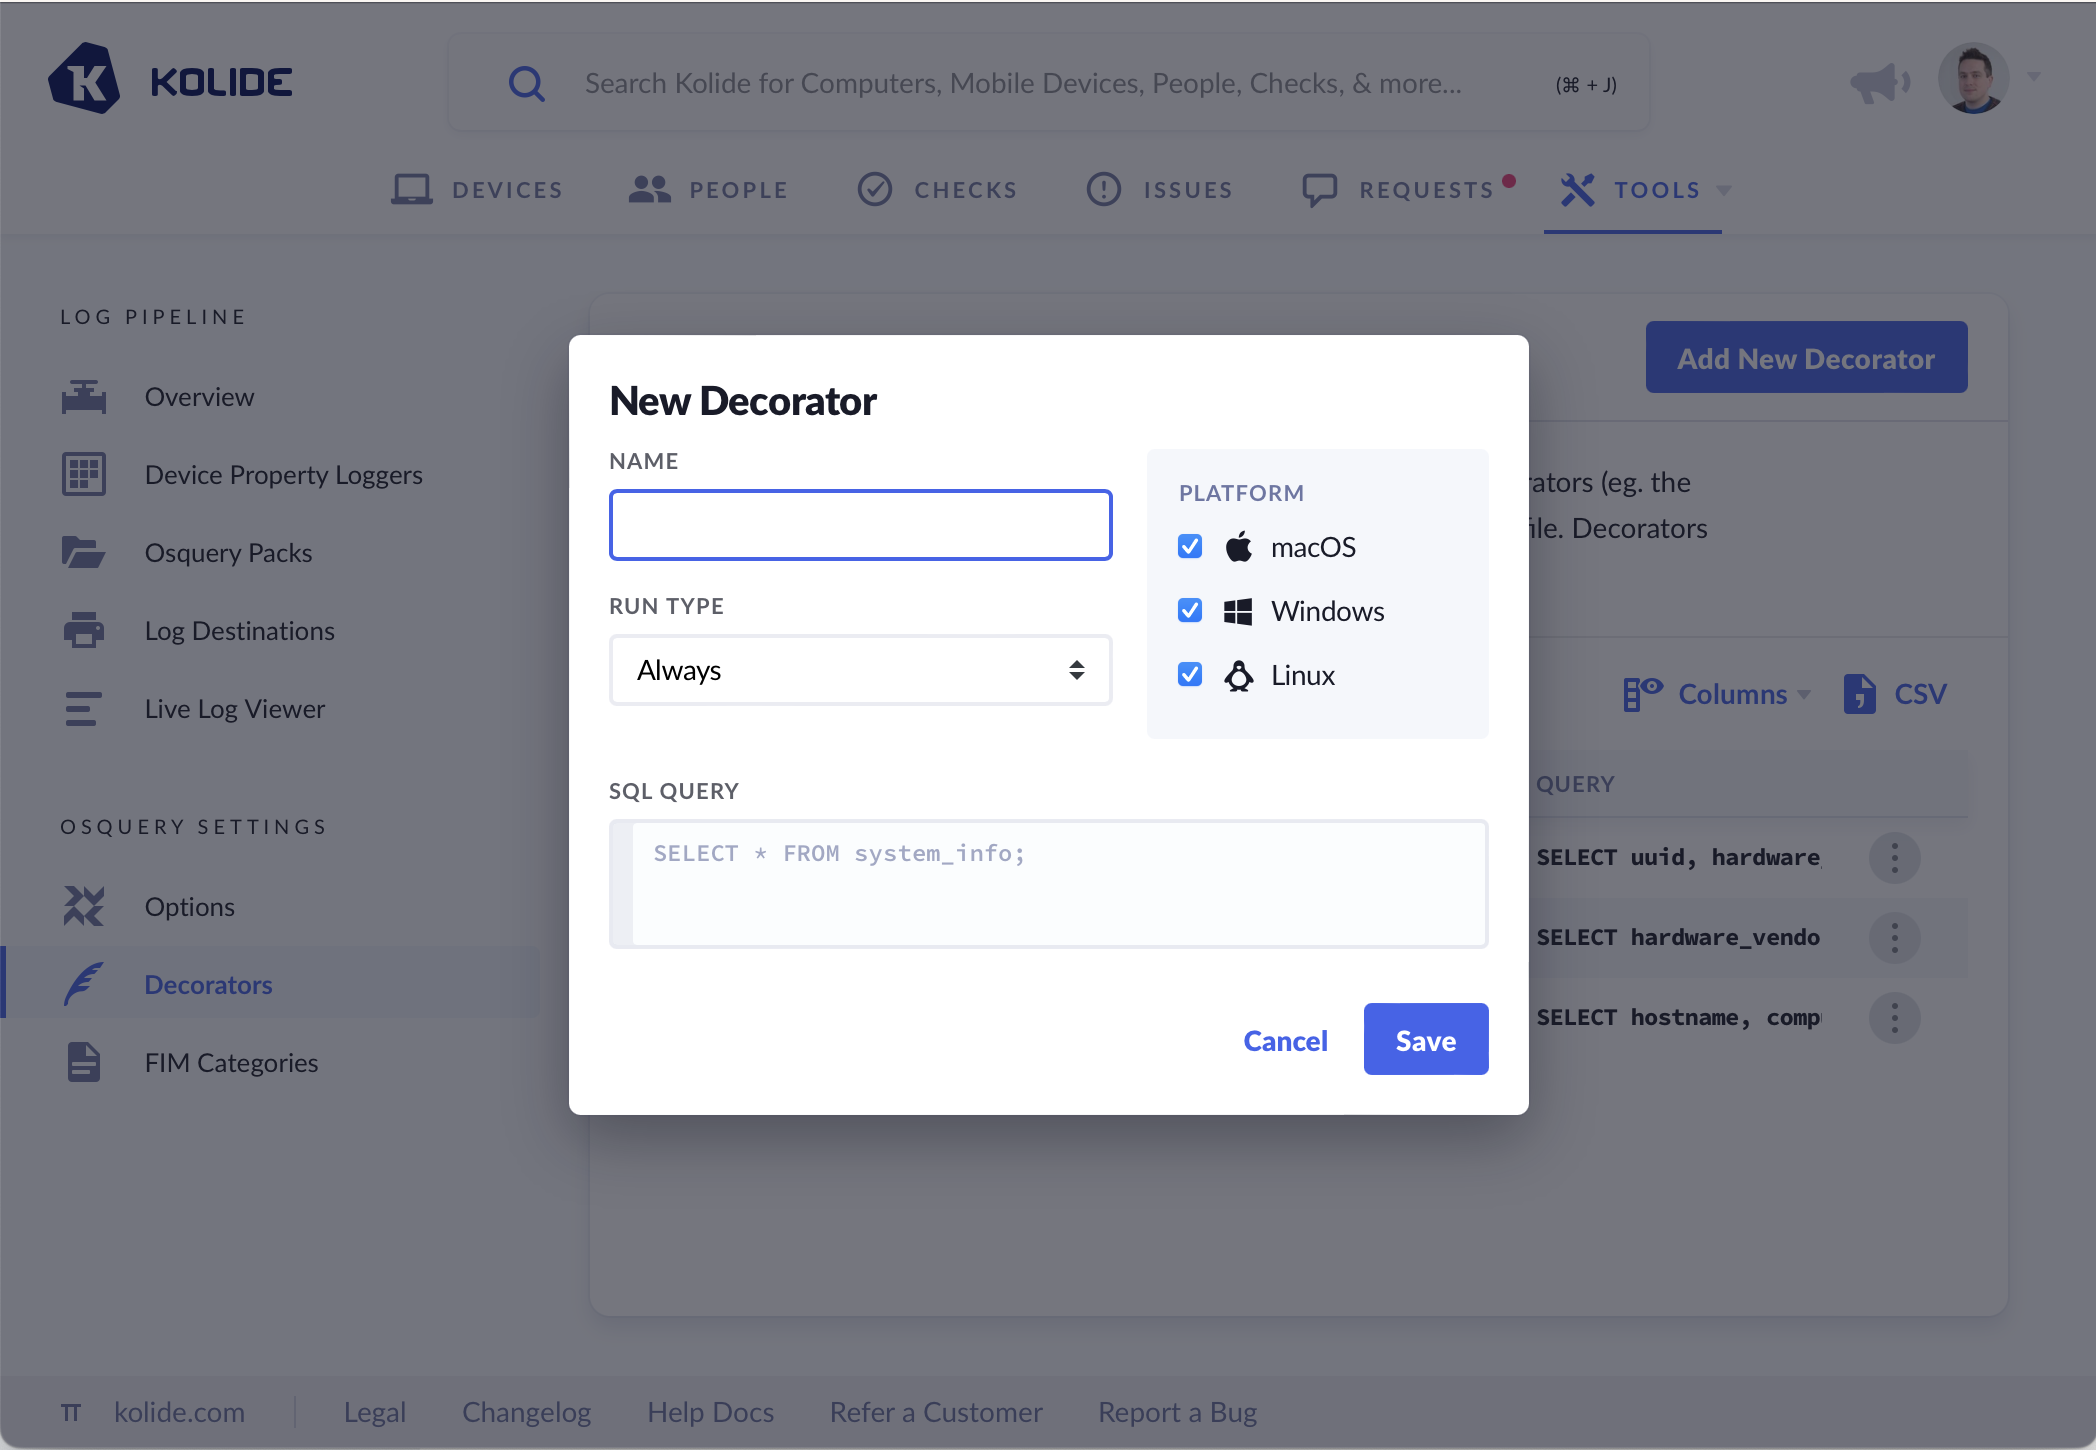
The dropdown marked Run Type provides three options for this setting.
- Always (default) - Run decorator every time the log is emitted
- Load - At the start when the computer starts up
- Interval - Specified interval (in seconds)
File Integrity Monitoring (FIM)
File integrity monitoring (FIM) is available for Linux (using inotify), macOS (using FSEvents), and Windows (using NTFS journal events). The daemon configures a watchlist of files/directories from the osquery configuration. The actions (and hashes when appropriate) on those selected paths populate the file_events table (macOS and Linux) or the ntfs_journal_events.
Proper configuration of the FIM requires two pieces:
- Specification of paths you wish to monitor.
- Configuration of a query pack with a valid
file_eventsorntfs_journal_eventsquery.
File Access Monitoring
File access monitoring is also available for macOS (using EndpointSecurity). Similar to FIM, the daemon configures a watchlist of files/directories from the osquery configuration. The actions on those selected paths populate the es_process_events and es_process_file_events tables.
File access monitoring and other osquery features that utilize the EndpointSecurity framework requires setting certain flags via Options under osquery settings. The flags you must set are:
-
ES FIM ENABLE OPEN EVENTS- true -
DISABLE ENDPOINTSECURITY- false -
DISABLE ENDPOINTSECURITY FIM- false
Proper configuration for file access monitoring also involves two additional steps:
- Specification of paths you wish to monitor.
- Configuration of a query pack with a valid
es_process_eventsores_process_file_eventsquery.
Setting up a FIM Category
To get started let’s first Create a New FIM Category, this will allow us to specify the paths on disk that we wish to monitor. There are two ways you can specify paths:
- Using predetermined paths
- Using SQL to programmatically return paths
Using predetermined paths:
To use predetermined paths you can select Provided List from the dropdown labeled paths defined by and add each path of interest on their own line as shown in the screenshot below:
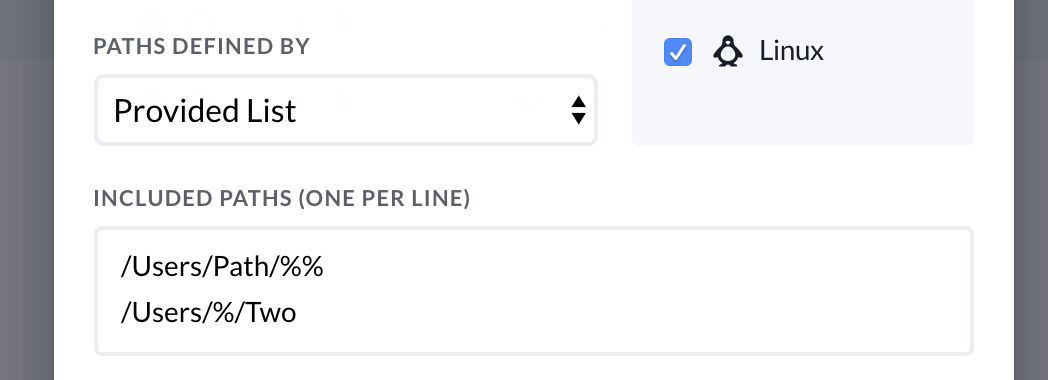
Paths can use wildcards to allow relative locations. This helps us deal with directories that would be uniquely named on each device. For example:
/Users/john/Library/%%
/Users/beth/Library/%%
We can use fnmatch-style, or filesystem globbing, patterns to represent the target paths. You may use standard wildcards * or SQL-style wildcards % .
A single wildcard (%) will return only files and folders at that level of the file-system hierarchy.
A double wildcard (%%) will recursively search the current level and any underlying subdirectories.
Matching wildcard rules
-
%: Match all files and folders for one level. -
%%: Match all files and folders recursively. -
%abc: Match all within-level ending in “abc”. -
abc%: Match all within-level starting with “abc”.
Matching examples
-
/Users/%/Library: Monitor for changes to every user’s Library folder. -
/Users/%/Library/: Monitor for changes to files within each Library folder. -
/Users/%/Library/%: Same, changes to files within each Library folder. -
/Users/%/Library/%%: Monitor changes recursively within each Library. -
/bin/%sh: Monitor the bin directory for changes ending in sh.
/Users/%%/%.conf
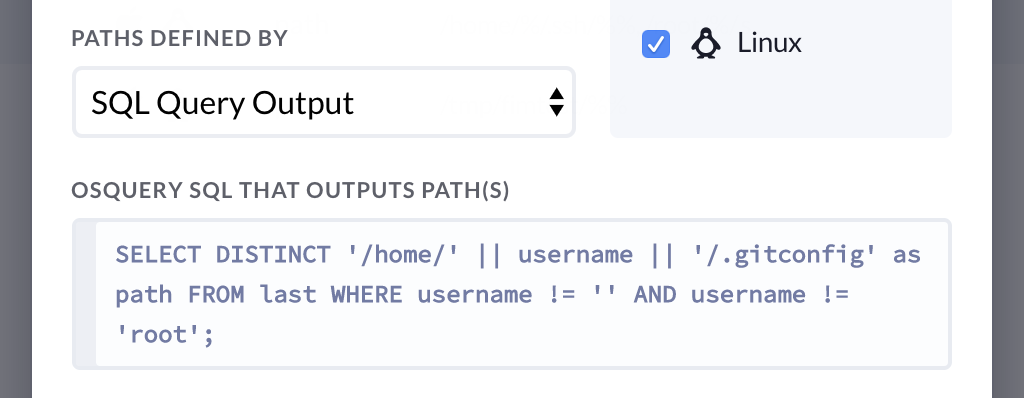
Using SQL to Programmatically return paths:
You may not know the location of your desired path ahead of time. In those cases, you can select SQL Query Output from the dropdown labeled paths defined by and add a valid SQL query such as shown in the screenshot below:
Excluding Paths:
In addition to choosing paths you wish to monitor, you may specify paths that you would like to exclude.

Configuring a Query Pack to retrieve results from the FIM
In order to retrieve these events, a Query Pack that queries the file_events table must first be configured. Query Packs are configured in the Logging Pipeline/Query Packs. An example Query Pack for retrieving FIM results could be:
{
  "queries": {
    "file_events": {
      "query": "SELECT * FROM file_events;",
      "interval": 600
    }
  }
}
You could paste the above JSON in as a New Query Pack
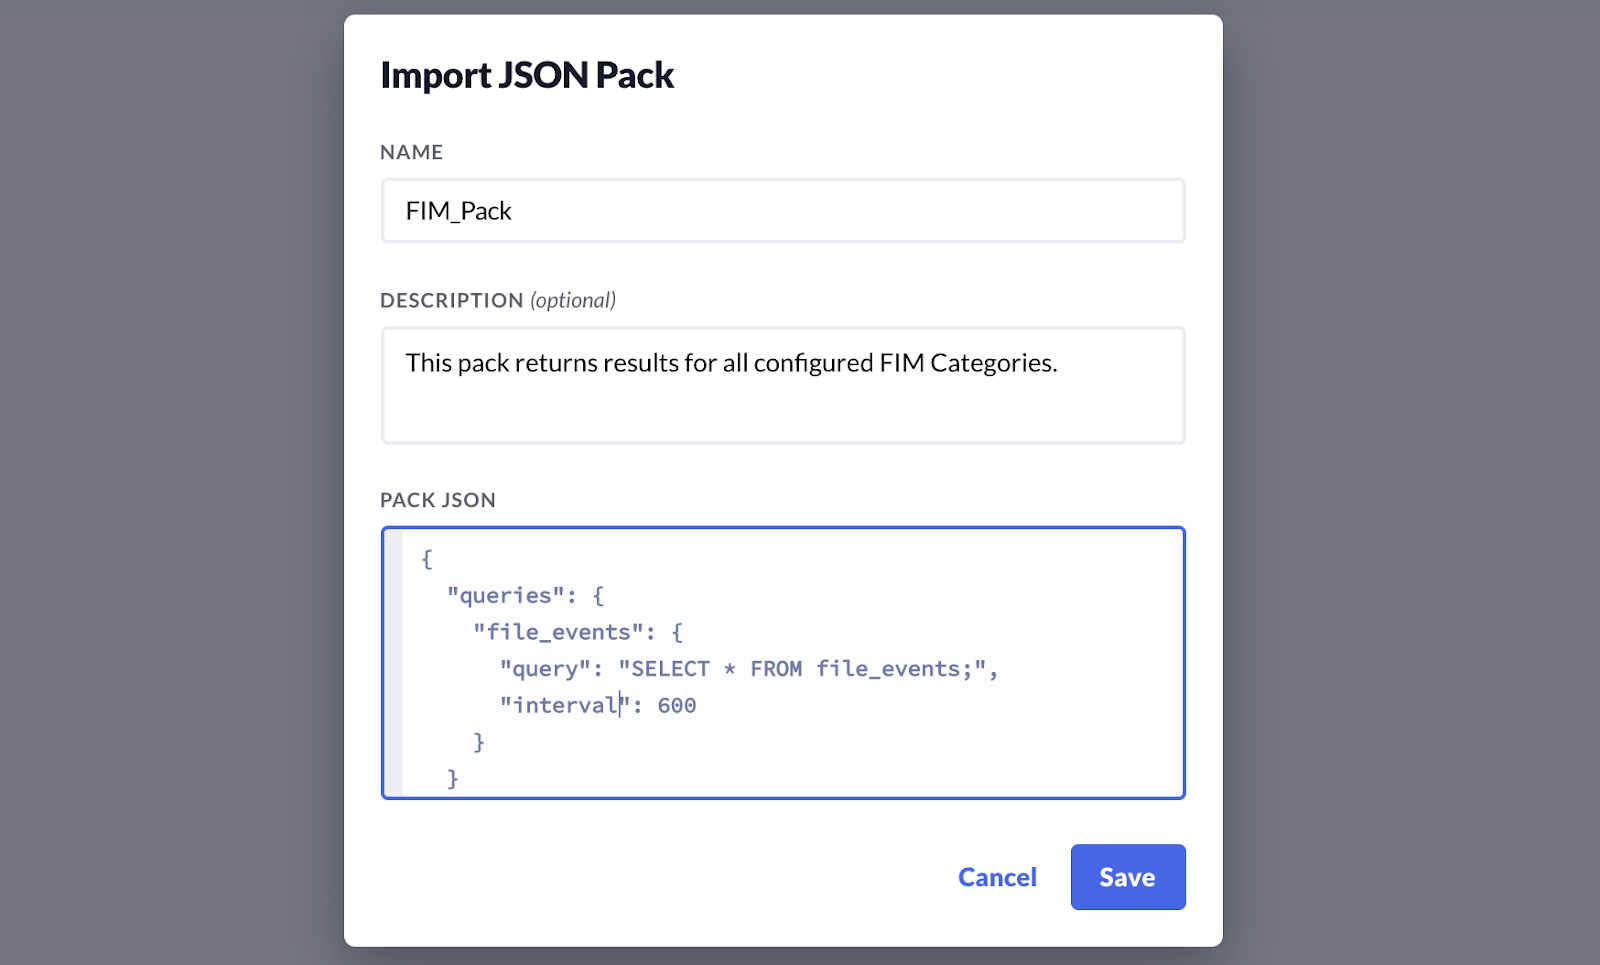
This pack would then return results for all of your configured FIM Categories.
As file changes happen in paths specified by FIM Categories, events will appear in the file_events table. During a file change event, the md5, sha1, and sha256 for the file will be calculated if possible. A sample event looks like this:
{
  "action":"ATTRIBUTES_MODIFIED",
  "category":"homes",
  "md5":"bf3c734e1e161d739d5bf436572c32bf",
  "sha1":"9773cf934440b7f121344c253a25ae6eac3e3182",
  "sha256":"d0d3bf53d6ae228122136f11414baabcdc3d52a7db9736dd256ad3ba",
  "target_path":"/root/.ssh/authorized_keys",
  "time":"1429208712",
  "transaction_id":"0"
}
For more information on Windows File Integrity Monitoring, check out our blog post on the subject.